

Moving Average Convergence Divergence and Stochastic oscillator - Divergence System
The Moving Average Convergence Divergence and Stochastic oscillator - Divergence System: Is another fantastic way to trader the long...
https://socfx.blogspot.com/2015/12/moving-average-convergence-divergence.html
The Moving Average Convergence Divergence and Stochastic oscillator - Divergence System:
Is another fantastic way to trader the longer term 1 hour and
up charts. I have personally manually back tested this system on
many currency pairs. Some perform better than others GBPUSD is the
best followed by EURUSD.All other are still profitable but the above 2
pairs are the superstars.
MACD divergence:
Now I know from experience that MACD divergence is not easy to understand and spot straight away, especially for newbie's.However please be patient as the patterns will jump out at you eventually.
First lets take a look at the MACD, below is a picture of the MACD indicator. MACD is probably the most common indicator ever used next to moving averages so you should not have any problem locating it on your charting platform.

Stochastic oscillator:
The stochastic oscillator measures over bought and over sold situations in the market. We are going to use this as our entry into a divergence setup. Below is a picture of the stochastic oscillator, we will be using the setting K%9 D%3 Slowing 3.
 The upper and lower horizontal lines going across the oscillator are our trigger lines. These lines are set at the values of 20 and 80.What we are basically looking for is the stochastic oscillator to be over bought above the 80 line if we are planning on going short and over sold below the 20 line if we are going long.
Let's say we have MACD divergence and we are looking to go long we then have to wait for the stochastic to go below the 20 line see example drawing below.

Once the fast stochastic line has passed though the 20 line you MUST wait for the current candle to finish to ensure it is a cross. The same rules apply to the 80 line for a sell trade.
You may be thinking how do I tell which is the fast line on the stochastic? Well its easy, it will be the fist one to pass through the lines the slow stochastic will be behind it.
Once you have added this to your chart with the MACD indicator lets go over the rules of the system and start looking at some actual trades.
MACD divergence:
Now I know from experience that MACD divergence is not easy to understand and spot straight away, especially for newbie's.However please be patient as the patterns will jump out at you eventually.
First lets take a look at the MACD, below is a picture of the MACD indicator. MACD is probably the most common indicator ever used next to moving averages so you should not have any problem locating it on your charting platform.

As
you can see it forms waves up and down like hills and
valleys.Now let's have a look at MACD along with price. If you look at
fig 1 below you can see that the MACD does not always follow price there
are occasions where MACD will show a lower high or a higher
low while price is doing the opposite.
These patterns are signals that price is running out of steam and may change direction soon. Can you spot it on the image above?
 The moving or spreading apart in different directions from a common point.In trading, “Divergence” is a term used to describe the phenomenon of price making one pattern, and an indicator making the opposite.
Let's look at fig 1.1 below with the divergence pointed out.On the chart fig 1.1 you can see I have marked that price is making a lower low while MACD is making a higher low.This is divergence and we are going to exploit it.For it to be a valid MACD divergence MACD must make a clear lower high or higher low consisting of two hills with a valley between.
 Below in fig 2 I have marked another example of MACD divergence price made a higher high move while MACD made a lower low indicating that price is out of steam and due for a small reversal.
 You can find MACD divergence on basically any time frame, all of the above were on the GBPUSD 1 hour charts. If you are totally lost with finding divergence then I recommend you do a Google search for MACD divergence and look at some more explanations.
These patterns are signals that price is running out of steam and may change direction soon. Can you spot it on the image above?

Let's look at fig 1.1 below with the divergence pointed out.On the chart fig 1.1 you can see I have marked that price is making a lower low while MACD is making a higher low.This is divergence and we are going to exploit it.For it to be a valid MACD divergence MACD must make a clear lower high or higher low consisting of two hills with a valley between.


Stochastic oscillator:
The stochastic oscillator measures over bought and over sold situations in the market. We are going to use this as our entry into a divergence setup. Below is a picture of the stochastic oscillator, we will be using the setting K%9 D%3 Slowing 3.

Let's say we have MACD divergence and we are looking to go long we then have to wait for the stochastic to go below the 20 line see example drawing below.

Once the fast stochastic line has passed though the 20 line you MUST wait for the current candle to finish to ensure it is a cross. The same rules apply to the 80 line for a sell trade.
You may be thinking how do I tell which is the fast line on the stochastic? Well its easy, it will be the fist one to pass through the lines the slow stochastic will be behind it.
Once you have added this to your chart with the MACD indicator lets go over the rules of the system and start looking at some actual trades.
System Rules:
The rules to this system are short and simple, I am going to list them below in the order before you can take a trade:
1. Look for MACD divergence against price. Price must be making higher highs or lower lows while MACD is doing the opposite.
2. Stochastic must be below the 80 line if you are looking to buy or above the 20 line if you are looking to sell.
3. Open trade once the fast stochastic line has passed though the line and THE CANDLE HAS CLOSED. Check that price has not already moved along way in your direction, if so you may want to consider leaving the trade.
4. Place your stop behind the most recent high/low or if that is too far set a stop x number of pips away. Usually around 30 pips if you are on the 1 hour charts.
5. Once price has gone in your favor by the same amount that you risked and the stochastic has moved to the other side you may want to consider moving you stop to break even or protecting some profit. I generally trail my stop and try to shoot for twice what I risked on the trade.
Trade Examples:
In fig 3 below there was a higher high on price while MACD formed a lower low. Once we see this all we have to do is wait for stochastic to move above the 80 line so we can initiate our short trade.
 The White arrow pointing down on fig 3 is the point at which stochastic went above the 80 line and the candle closed. On the open of the very next candle we open our sell trade with the stop above the high point.
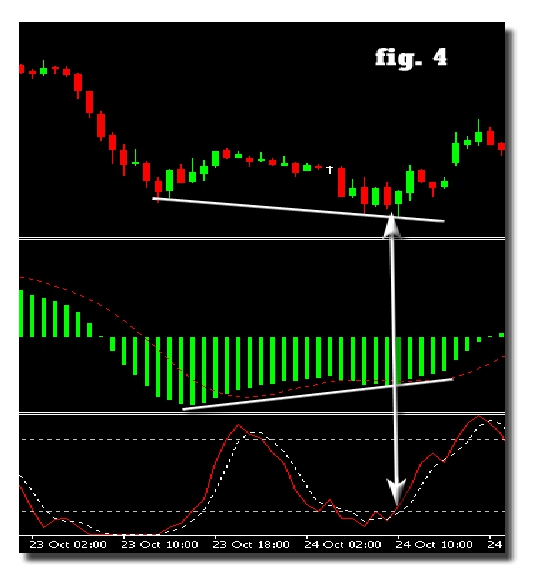
Below in fig 4 there is another example of a divergence trade:And remember you can't make the trade until the candle has closed!

The rules to this system are short and simple, I am going to list them below in the order before you can take a trade:
1. Look for MACD divergence against price. Price must be making higher highs or lower lows while MACD is doing the opposite.
2. Stochastic must be below the 80 line if you are looking to buy or above the 20 line if you are looking to sell.
3. Open trade once the fast stochastic line has passed though the line and THE CANDLE HAS CLOSED. Check that price has not already moved along way in your direction, if so you may want to consider leaving the trade.
4. Place your stop behind the most recent high/low or if that is too far set a stop x number of pips away. Usually around 30 pips if you are on the 1 hour charts.
5. Once price has gone in your favor by the same amount that you risked and the stochastic has moved to the other side you may want to consider moving you stop to break even or protecting some profit. I generally trail my stop and try to shoot for twice what I risked on the trade.
Trade Examples:
In fig 3 below there was a higher high on price while MACD formed a lower low. Once we see this all we have to do is wait for stochastic to move above the 80 line so we can initiate our short trade.

Below in fig 4 there is another example of a divergence trade:And remember you can't make the trade until the candle has closed!
Below in fig 5 is another example.
 Below is another example but in this example we had two setups that worked out very well.
 Conclusion:
Although this system trades against the trend which is something I normally would not advise It has proven to be very profitable over the past few years that I have used it. I have found the 1 hour and 4 hour to be my favorite time frames to trade and I keep an eye on a few pairs to give me plenty of options.
Many people struggle when first learning to spot divergence, don’t worry if your one of them. Keep looking for examples on your charts and compare them to those in this tutorial, it wont be long before you will be trading divergence like a pro and reaping the rewards.
As with the previous systems you will benefit greatly by using candlestick formations as a second confirmation for entry which will be discussed in my next tutorial.


Hey Everybody,
ReplyDelete"Which Forex pair and time frame is best to trade" is the frequently asked question and I want do give you the EXPLICIT ANSWER in this comment.
Are you expecting that I am going to say something like EUR/CHF on 5-minute time frame or GBP/USD on daily...? No, it is not so simple, but SIMPLE ENOUGH we can figure it out!
The "DIFFICULTY" is that markets change over time. If EUR/USD was a well trending currency pair a few years ago, today it is another one.
I actually want to let you know about a SPECIAL INSTRUMENT that I use to find the BEST TRENDING PAIRS among all the Forex pairs.
GET THE SOFTWARE: ForexTrendy
The instrument examines 34 Forex pairs on all time frames from minute to monthly. This way you choose the best trending pair and time frame at the current time.
LINK FOR SOFTWARE: ForexTrendy