The Gartley Pattern-How to Identify it on The Chart
In continuation of our series on harmonic pattern Identification. Today we’re going identify the Gartley Pattern, another pattern formation ...
https://socfx.blogspot.com/2015/09/the-gartley-pattern-how-to-identify-it.html
In continuation of our series on harmonic pattern Identification. Today we’re going
identify the Gartley Pattern, another
pattern formation that occurs frequently as well on the financial market or any
other instruments just like the Alternate
Bat Pattern. The success or win-rate of this pattern is around 80%, which
is great in the world of real, trading methods.
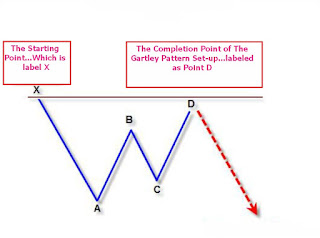


The Gartley
Pattern Formation in Summary:
·
The A-B leg
retraces about 61.8% of the X-A leg (Very critical for identification of the
pattern)
·
The B-C leg
retraces 38.2% to 88.6% of the A-B leg
·
The C-D leg
ends at around 127% to 161.8% of the B-C
leg (projection)
·
The C-D leg
ends also at around 78.6% retracement of the major X-A leg or
·
The C-D leg ends
at around 113% of the X-A leg extension.
The Bearish Bat Pattern:
This pattern as
illustrated in the image below is more like an W-type formation that makes use
of the 78.6% and occasionally 113% XA leg retracement and extension of the
Fibonacci tool, as the defining support level in the Potential Reversal
Zone{PRZ}.And the BC projection use an extreme harmonic ratio that is at least
a 127%% extension.

You might want to read my post on A Cheat Sheet or a Quick Guide In Identifying Harmonic Patterns
The Bullish Bat Pattern:
This pattern as
illustrated in the image below is more like an M-type formation that makes use
of the 78.6% and occasionally 113% XA leg retracement and extension of the
Fibonacci tool, as the defining support level in the Potential Reversal
Zone{PRZ}.And the BC projection use an extreme harmonic ratio that is at least
a 127%% extension.

How To Trade This Pattern:
Now how do
we plan a trade around this nice formation in order to make some real dough?
The answer is not
far-fetched.

Your entry would be to buy or sell the area where the 78.6%
of X-A and 127% of B-C meet or at most at around 113% of X-A leg. I love
entering a trade using a base pattern set-up formation.
·
Your stop
loss would be below the origin of the X-A. Meaning below the high or low
that is X or above 113%
·
For targets,
some traders use the 61.8% as a minimal target, and copy the X-A leg and
project it from the point D for the extended target of 127%.
·
For trailing
your stop, you can raise it to a break-even as soon as the minimal target is
achieved.
Now let’s look at a real trading scenario on how to identify this
pattern in an extreme bullish market condition and trading the reverse…lets go
guys!

Since we're looking to trade bearish Gartley...looking at the above chart price price rallied and retraces to create the X-A leg and rallied again to create the B point and then retraces again,please the see what transpired later the pattern forms,see image below:

Now to add to the accuracy of predicting the price reversal level at D, we look at the 78.6% or 113% or extension retracement of X-A or , and the 127% projection of B-C. Below is the rest of the pattern lines on the price action.

Below is the aftermath of what happened , price eventually rallied to the 113% of X-A leg and tested the entire zone before nose-diving and hitting targets.

Use the comment box below and express yourself!